Home
SystemStar Guided Tour
SystemStar Features
SystemStar Facts
Download Demo
Price List
Training
COCOMO Overview
COCOMO History
COCOMO Cost Drivers
COCOMO II Features
Function Points
Incremental COCOMO
Calibration
COSYSMO Overview
COSYSMO Features
Links
FAQ
What's New
Contact Us
Home
SystemStar Guided Tour
SystemStar Features
SystemStar Facts
Download Demo
Price List
Training
COCOMO Overview
COCOMO History
COCOMO Cost Drivers
COCOMO II Features
Function Points
Incremental COCOMO
Calibration
COSYSMO Overview
COSYSMO Features
Links
FAQ
What's New
Contact Us
![]() Prev Page |
Start of Tour |
Next Page
Prev Page |
Start of Tour |
Next Page ![]()
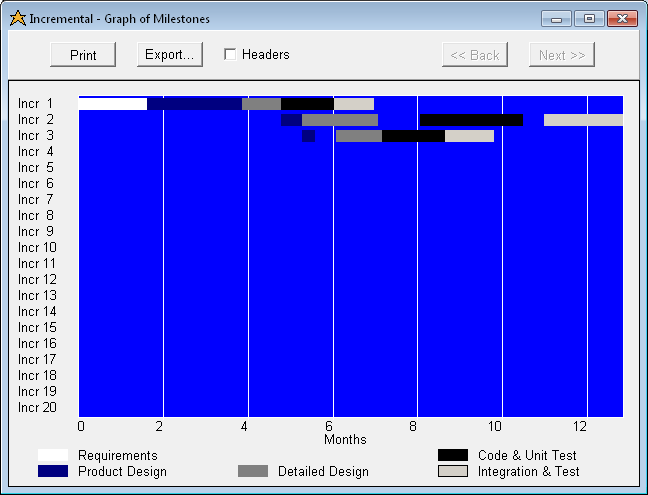
This image depicts the Graph of Milestones. The graph shows when each phase of each increment will start and end. It also lets you see how the increments are synchronized.
You can break your estimate up into as many as 20 increments. Using an incremental approach lets you deliver a release to your customer earlier, reducing risks.
![]() Page 7 of 13
Page 7 of 13
![]()