Home
SystemStar Guided Tour
SystemStar Features
SystemStar Facts
Download Demo
Price List
Training
COCOMO Overview
COCOMO History
COCOMO Cost Drivers
COCOMO II Features
Function Points
Incremental COCOMO
Calibration
COSYSMO Overview
COSYSMO Features
Links
FAQ
What's New
Contact Us
Home
SystemStar Guided Tour
SystemStar Features
SystemStar Facts
Download Demo
Price List
Training
COCOMO Overview
COCOMO History
COCOMO Cost Drivers
COCOMO II Features
Function Points
Incremental COCOMO
Calibration
COSYSMO Overview
COSYSMO Features
Links
FAQ
What's New
Contact Us
![]() Prev Page |
Start of Tour |
Next Page
Prev Page |
Start of Tour |
Next Page ![]()
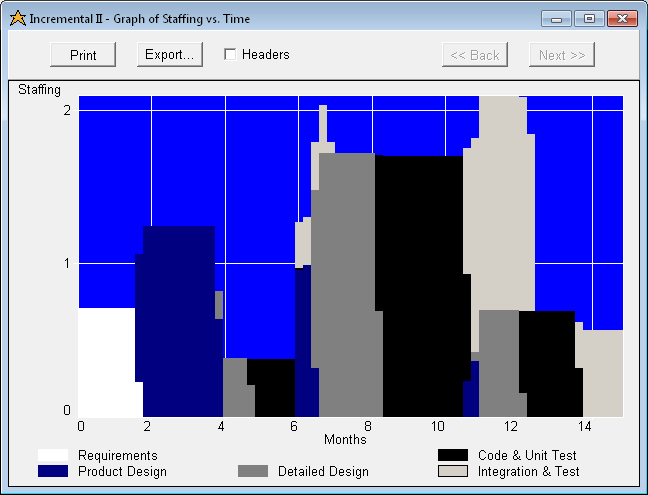
This image depicts the graph of Staffing vs. Time, calculated from the COCOMO effort equation. The graph indicates how many people you'll need each month, and what phase they'll be working on. This graph is for an incremental project, so Detailed Design (for example) is done for each increment.
![]() Page 6 of 13
Page 6 of 13
![]()